Catalog of Math Shapes
Posted on 3/27/2021
Tags: Math
I enjoy drawing shapes using math. Much of the fun is exploring what formulas look like and figuring out how to warp them to look different.Tags: Math
To be able to build more complex shapes and animations, in this post I'll explore some formulas and create a catalog of shapes.
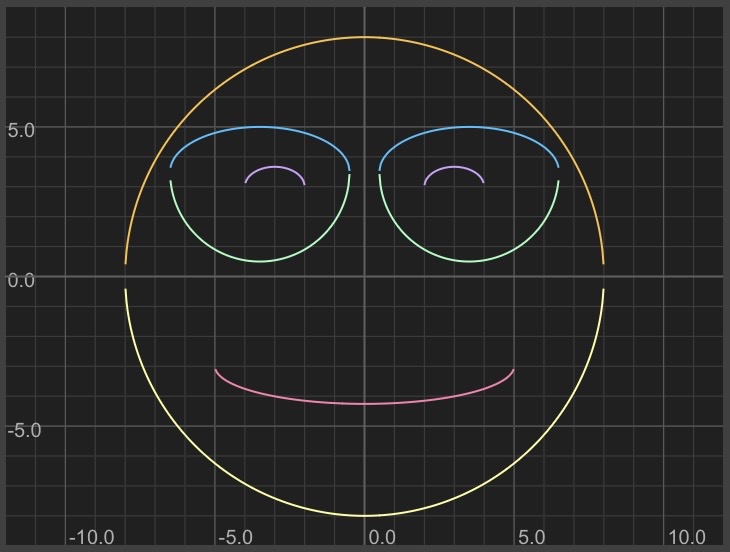
Circles:
x^2 + y^2 = 1
Graphtoy requires that we solve for y to create a function of x: f(x)
y^2 = 1 - x^2
y = ± sqrt(1 - x^2)
f(x) = y = ± sqrt(1 - x^2)
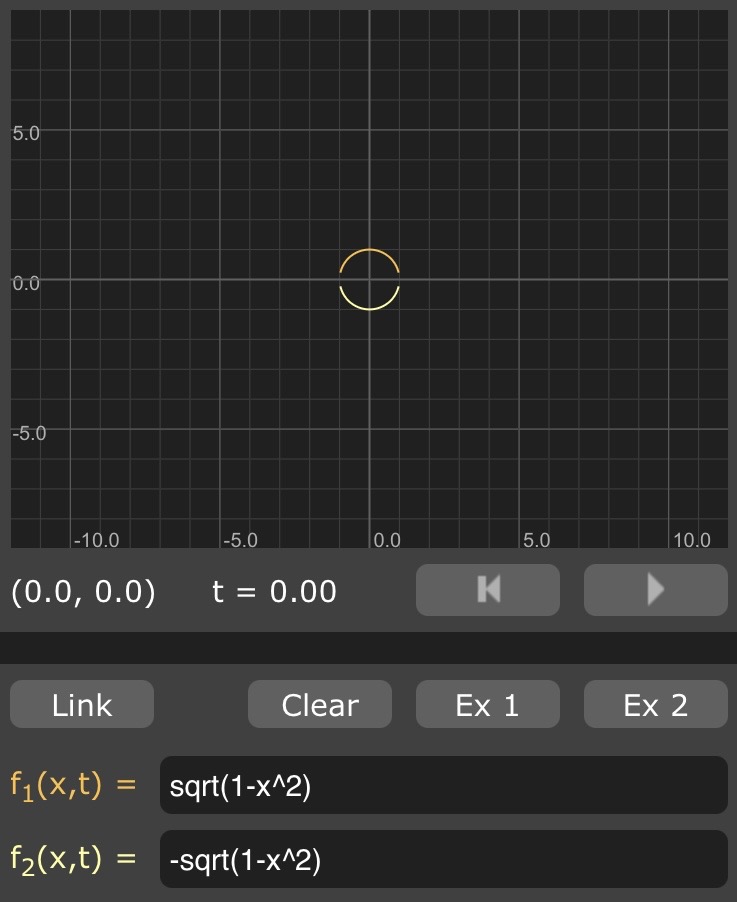
Graphtoy doesn't understand ± so we need to write two separate formulas:
y = sqrt(1 - x^2)
y = -sqrt(1 - x^2)
Graphtoy link
Here's what that looks like:
In general, we can shift formulas up/down by adding/subtracting to/from the function. Here, we shift the circle up the y-axis by 2:
y = sqrt(1 - x^2) + 2
y = -sqrt(1 - x^2) + 2
Graphtoy link
And we can shift left/right similarly by adding/subtracting from every instance of "x". Here, we shift the circle left on the x-axis by 3:
y = sqrt(1 - (x+3)^2)
y = -sqrt(1 - (x+3)^2)
Graphtoy link
We can combine these two techniques to shift left and up at the same time:
y = sqrt(1 - (x+3)^2) + 2
y = -sqrt(1 - (x+3)^2) + 2
Graphtoy link
Lines:
y = mx + b
m is the slope (change in y divided by change in x)
b is the y-intercept (notice that adding b is the same technique we used to shift the circle up)
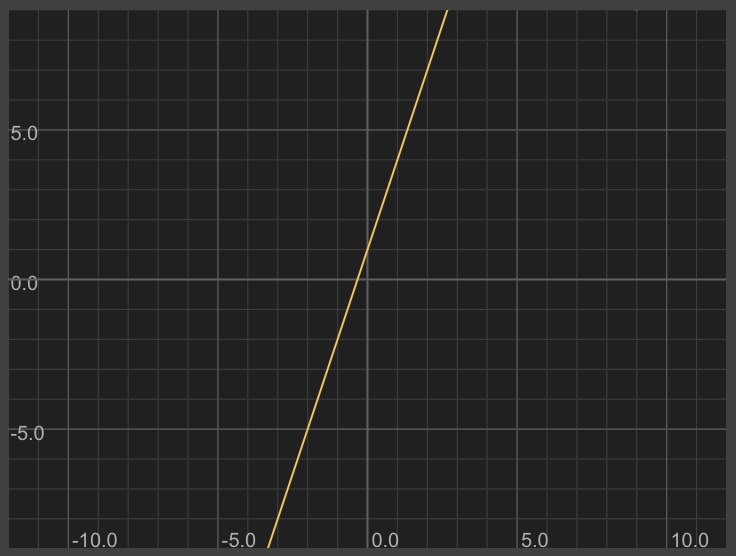
Here's a steep line that goes up 3 in the y direction for every increase of 1 in the x direction. I shifted it to intersect with the y-axis at y=1
y = 3*x + 1
Graphtoy link
Here's what that looks like:
In general, we can flip the shape over the x-axis by making it negative (notice this is similar to the way we draw the bottom half of a circle, by flipping the formula to the top half):
y = - (3*x + 1)
Graphtoy link
Similarly, we can flip a shape over the y-axis by replacing every instance of "x" with "-x":
y = 3*(-x) + 1
Graphtoy link
Sine wave:
y = sin(x)
Graphtoy link
Here's what that looks like:
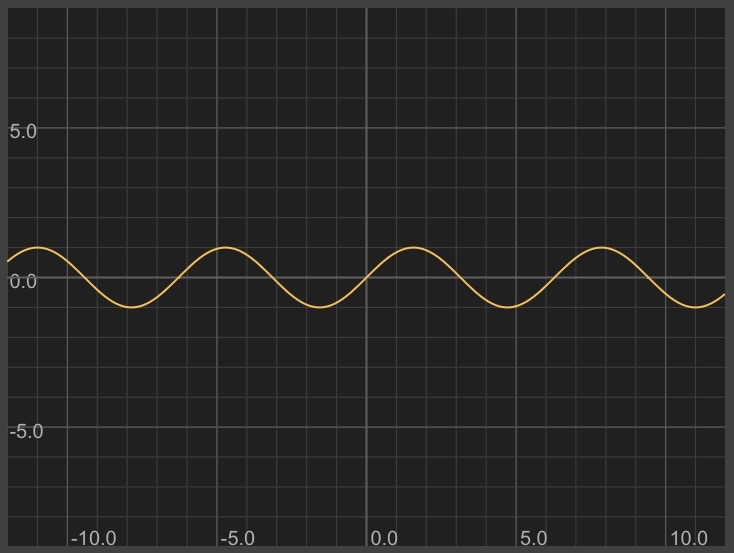
Something special about the shape of sin(x): it's periodic, repeating infinitely.
Parabola:
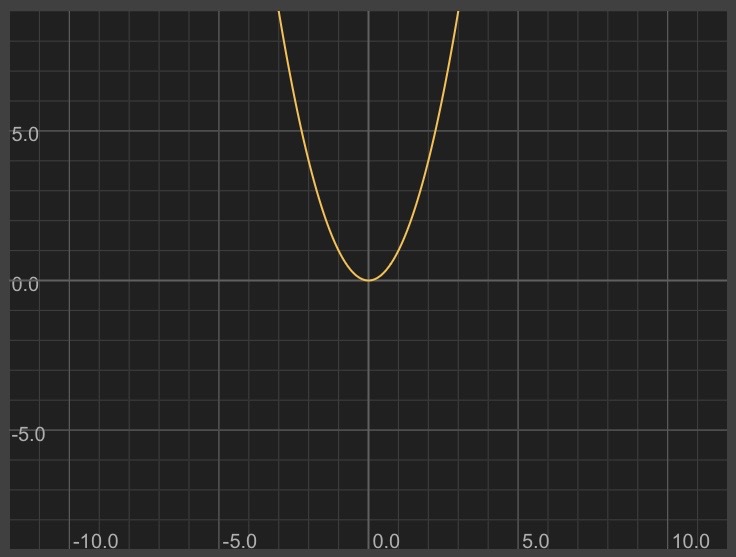
y = x^2
Graphtoy link
Here's what that looks like:
If we want to turn a shape sideways (by swapping the axes), we can swap x and y.
Sideways parabola:
x = y^2
Solve for y to be able to graph using Graphtoy:
y = ± sqrt(x)
y = sqrt(x)
y = -sqrt(x)
Graphtoy link
Combining shapes:
We can combine formulas to combine their shapes. For example, we can make a sine wave follow the shape of a line by adding them together:
Diagonal line:
y = x + 3
Sine wave:
y = sin(3*x)
Diagonal sine wave:
y = x + 3 + sin(3*x)
Graphtoy link
Steps (floor):
We can do some neat things using functions like floor and ceil. Floor rounds down to the nearest integer. Ceil rounds up to the nearest integer.
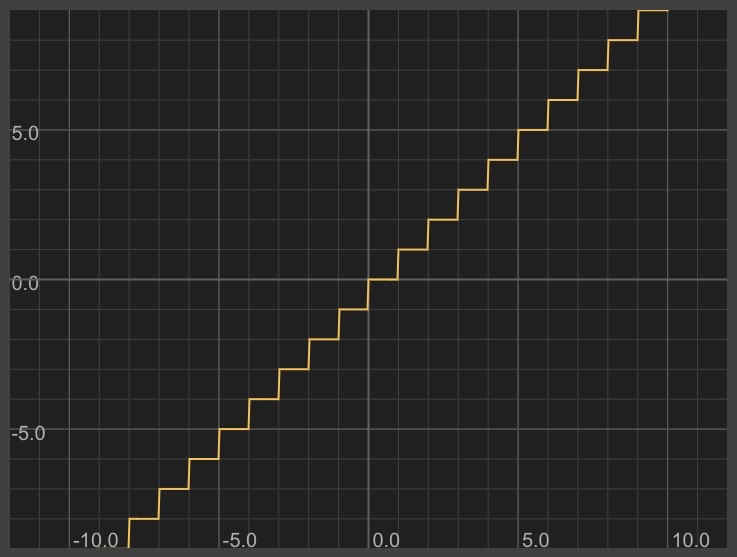
y = floor(x)
Graphtoy link
This looks like steps!
We can make a spiky sawtooth wave by only giving y the decimal portion of x like this:
y = x - floor(x)
Graphtoy link
To get an intuitive understanding of a shape, sometimes it helps to write out some of the values in a table:
x floor(x) x-floor(x)
=============================
0 0 0
0.2 0 0.2
0.5 0 0.5
1 1 0
1.2 1 0.2
1.5 1 0.5
2 2 0
2.2 2 0.2
2.5 2 0.5
This hopefully makes it easier to see how this ends up looking like a sawtooth.=============================
0 0 0
0.2 0 0.2
0.5 0 0.5
1 1 0
1.2 1 0.2
1.5 1 0.5
2 2 0
2.2 2 0.2
2.5 2 0.5
Triangle wave:
A sawtooth wave looks like this: /|/|/|/|
A flipped sawtooth wave looks like this: |\|\|\|\
A triangle wave looks like this: /\/\/\/\
I noticed that I might be able to construct a triangle wave by combining a sawtooth wave with a flipped sawtooth wave.A flipped sawtooth wave looks like this: |\|\|\|\
A triangle wave looks like this: /\/\/\/\
The naive approach of simply adding them together gives us this:
Sawtooth wave:
y = x - floor(x)
Flipped (across the y-axis) sawtooth wave:
y = -x - floor(-x)
(Note: when writing this, I accidentally flipped the formula over the x-axis: y = -(x-floor(x)). When I graphed it, I realized my mistake and played around with the -s to get it right. It's normal to play around and make mistakes! Make some terms negative and see what happens to the shape!)
Added together:
y = x - floor(x) + -x - floor(-x)
Graphtoy link
Ah woops! That looks like a straight line. Graphing the sawtooth waves on top of each other reveals why: the diagonal portions cross each other, summing up to a constant value for most values of x.
Graphtoy link
To get a triangle wave, I need to alternate taking a tooth from each sawtooth wave. I can take a tooth from one wave when floor(x) is even; a tooth from the other wave when floor(x) is odd.
That sounds pretty crazy! Fortunately, modular division is an easy way to test whether a number is even or odd.
floor(x) % 2
also written as:
x mod(floor(x), 2)
==============================
1 1 (odd)
1.9 1 (odd)
2 0 (even)
2.9 0 (even)
3 1 (odd)
4 0 (even)
Our gadget to determine when floor(x) is odd: mod(floor(x), 2)also written as:
x mod(floor(x), 2)
==============================
1 1 (odd)
1.9 1 (odd)
2 0 (even)
2.9 0 (even)
3 1 (odd)
4 0 (even)
We can use that to make a complementary gadget to determine when floor(x) is even: 1-mod(floor(x), 2)
Sawtooth wave:
y = x - floor(x)
Flipped (across the y-axis) sawtooth wave:
y = -x - floor(-x)
Using our gadgets to zero out every other tooth:
zero out even teeth zero out odd teeth
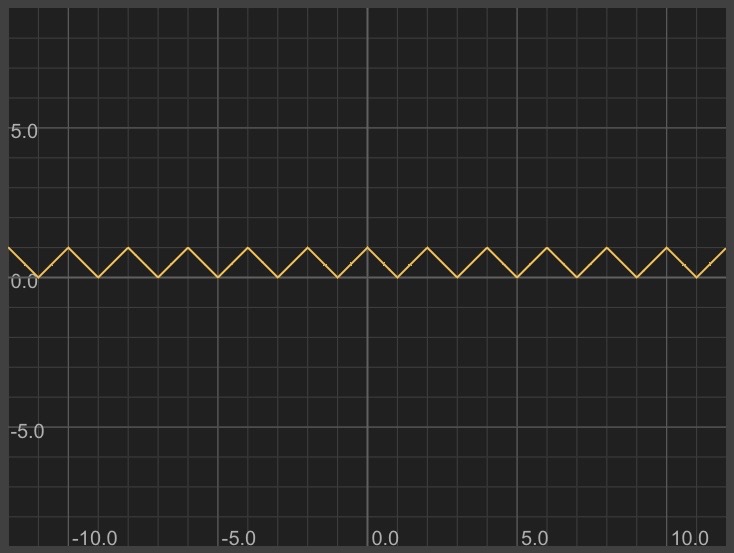
y = mod(floor(x), 2) * (x-floor(x)) + (1-mod(floor(x), 2)) * (-x-floor(-x)))
Graphtoy linky = mod(floor(x), 2) * (x-floor(x)) + (1-mod(floor(x), 2)) * (-x-floor(-x)))
Here's what that looks like:
Notice that there are some visible glitches. Let's check the math:
y = mod(floor(x), 2) * (x-floor(x)) + (1-mod(floor(x), 2)) * (-x-floor(-x)))
Plug in x = 0:
y = mod(floor(0), 2) * (0-floor(0)) + (1-mod(floor(0), 2)) * (-0-floor(-0)))
y = 0 * (0-floor(0)) + (1-0) * (-0-floor(-0)))
y = 0
Ah but y is supposed to be 1. It looks like the equation has a bug.
Checking a few more x, y values to build intuition:
x y y is supposed to be
============================
0 0 1
1 0 0
2 0 1
3 0 0
4 0 1
In its current form, our formula is taking neither sawtooth's value when x is a perfect integer (looking at the formula, you can see that it's because (x-floor(x)) and (-x-floor(-x)) are always 0 when x is an integer.============================
0 0 1
1 0 0
2 0 1
3 0 0
4 0 1
One fix is to add a term to our formula that has the value 1 for even integers and 0 otherwise.
I played around and came up with this:
(1-mod(floor(x),2))*(1-ceil(x-floor(x)))
The first half of this is our even/odd gadget. The second half is an expression that is 1 for integers, 0 otherwise.
Checking its values:
(1-mod(floor(x),2)) *
x 1-mod(floor(x),2) 1-ceil(x-floor(x)) (1-ceil(x-floor(x)))
=================================================================
0 1 1 1*1 = 1
0.5 1 0 1*0 = 0
1 0 1 0*1 = 0
1.5 0 0 0*0 = 0
2 1 1 1*1 = 1
Fixed equation by adding this gadget:x 1-mod(floor(x),2) 1-ceil(x-floor(x)) (1-ceil(x-floor(x)))
=================================================================
0 1 1 1*1 = 1
0.5 1 0 1*0 = 0
1 0 1 0*1 = 0
1.5 0 0 0*0 = 0
2 1 1 1*1 = 1
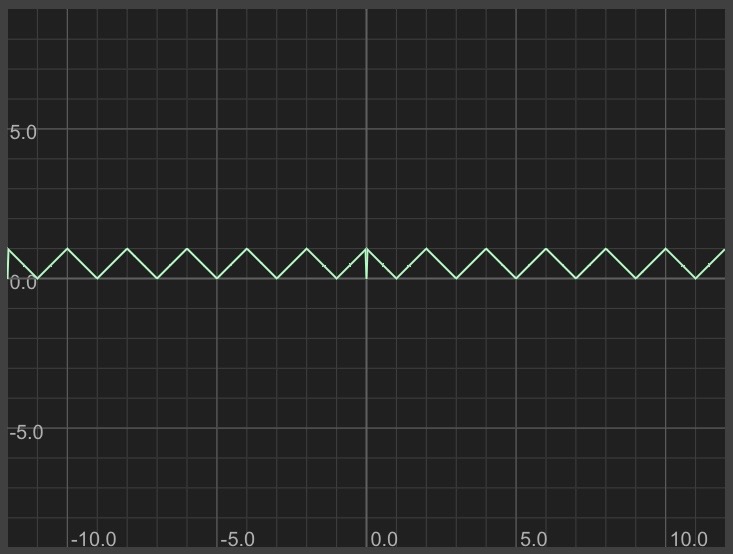
y = (mod(floor(x),2))*(x-floor(x))+(1-mod(floor(x),2))*(-x-floor(-x)) + (1-mod(floor(x),2))*(1-ceil(x-floor(x)))
Graphtoy link
Here's what the fixed equation looks like:
Looks perfect! Our formula is pretty complex, though. It's possible we could come up with a simpler formula by reading this Wikipedia page.
Square wave:
Here's one way to make a square wave: take an already periodic formula and make it blocky.
An easy periodic formula is sin(x).
y = sin(x)
Instead of having the period of sin be 2*PI, I can change it to be 2:
y = sin(x*PI)
I can use the "sign" function to turn positive values into 1 and negative values into -1:
y = sign(sin(x*PI))
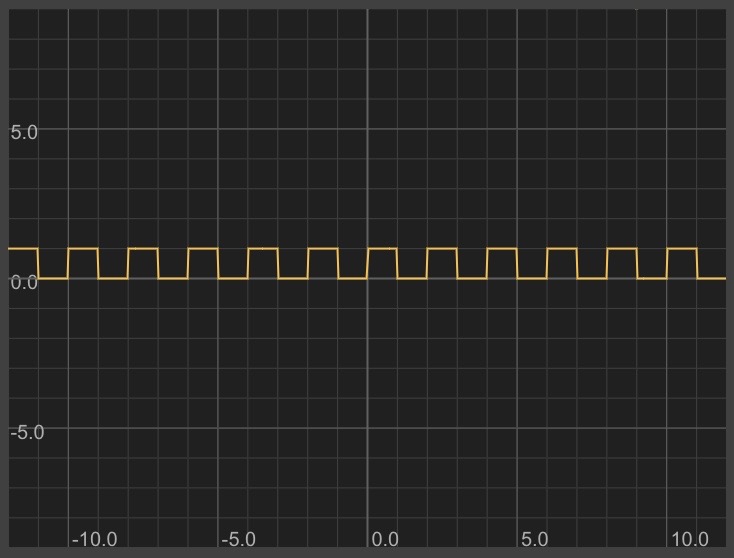
If I want it to be truly square (1 tall and 1 wide), I'll need to adjust the height and shift it up:
y = sign(sin(x*PI))/2 + 0.5
Graphtoy link
Here's what that looks like:
How did I come up with these formulas and techniques? I remember many of these from school and others I (re)discovered by playing around. You can expand your own catalog by trying out new formulas to see what they look like and taking notes!
Here's a list of interesting things to explore:
log(x)
exp(x)
abs(x)
pow(x, n)
This animation that is built into Graphtoy
Growing concentric circles
Bouncing ball animation
Inigo Quilez's Useful Little Functions (my backup)