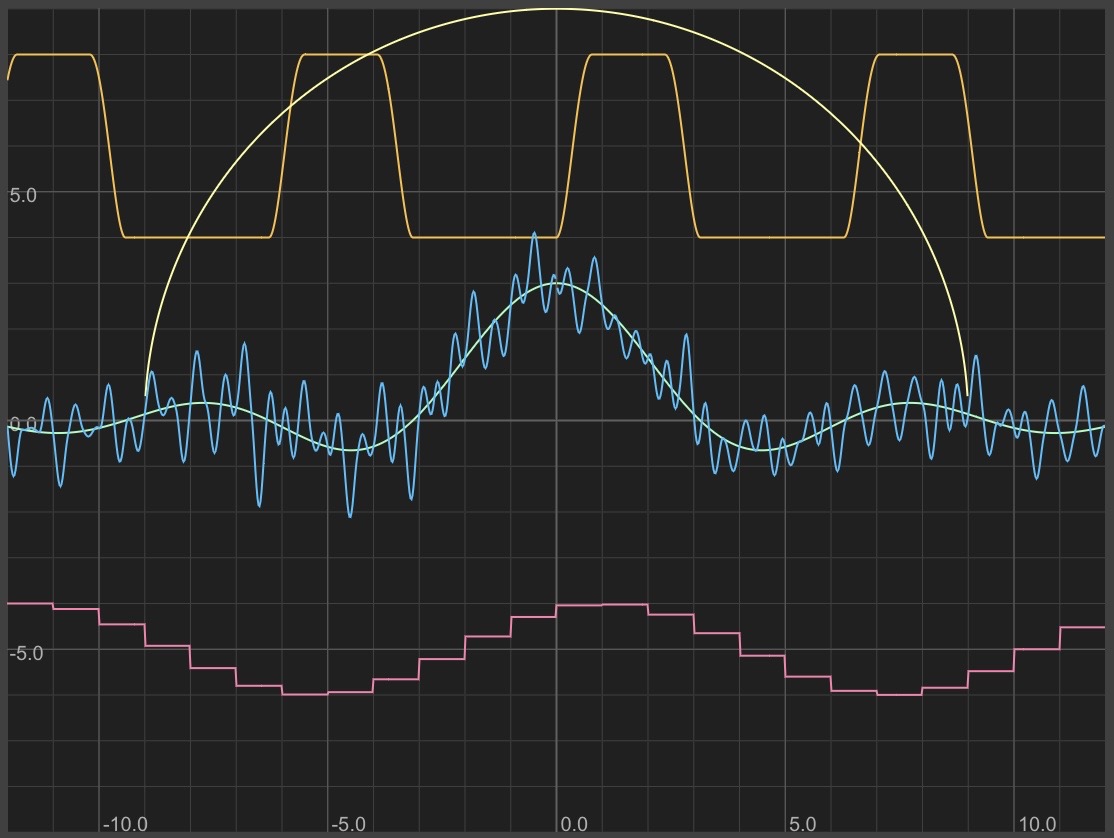
Draw Shapes Using Math

Posted on 3/21/2021
Tags: Math
Computer graphics is a wonderful real-world use case for a lot of the math we learn in school. For example, take a look at Inigo Quilez's video tutorials. This one is particularly cool.Tags: Math
I don't have skills like Inigo but I still have fun making 2D shapes using math.
Here are a few fun tools for drawing 2D shapes using math:
- FormulaGraph
- ** Added to this list in August 2021 **
- After originally publishing this list, I built my own formula grapher by combining Relplot and Graphtoy (both mentioned below)
- Features: interactive graphs, convenient UI, animate with time, available in any web browser, graph formulas (not just functions), graph polar formulas, graph inequalities
- See the full details here
- TI calculators
- You might have had one of these in high school
- I had a TI-83 Plus which turned out to be a fun device. Here are some of its neat features:
- BASIC programming
- Play games in MirageOS (back in my day the most popular game was Phoenix and it looks like people kept innovating since then! They even made a version of Geometry Wars!)
- Share programs and games via a cable (they spread through the whole high school this way)
- Graph interesting equations and shapes
- There's a graphing mode which traces a function's shape with an animating circle. An upperclassman graphed some functions together which made it look like this circle was a ball bouncing down stairs. This stuck with me and is part of the inspiration for this post!
- Looking back, I'm glad we got to play with these! Thank you, TI-83 Plus, for my earliest programming and engineering experiences!
- Graphing calculator websites
- WolframAlpha
- Very powerful. For example: graphing x^y = y^x, including symbolically refactoring the equation to solve for y.
- Meta-Calculator
- OK in a pinch
- FooPlot
- Source code
- Fairly full-featured!
- Graphing calculator apps
- GeoGebra Graphing Calculator
- This app is really good! Much like WolframAlpha and Relplot, this app can graph arbitrary equations and inequations like x^y = y^x, 1 = x^2 + y^2, y > x, etc.
- Desmos Graphing Calculator
- This app might be even better. It also supports polar equations (e.g. r = cos(4*theta)).
- Also available as a website
- NumWorks Graphing Calculator (simulates a physical calculator; hard to use)
- Relplot
- Powerful graphing capabilities: arbitrary equations and inequations
- Source code (my backup)
- Relplot is written by one of my favorite CS professors, Andrew Myers!
- In fact, it's a more sophisticated version of a programming assignment we completed in his Functional Programming course
- Interesting implementation details:
- Lexes and parses inputted formulas so they can be evaluated
- Slightly refactors the formulas to be of the form "0 = formula" or "0 > formula":
Eqn : Expr EQUALS Expr (Plus(Expr1, neg(Expr2)))
| Expr LT Expr (Ltz(Plus(Expr1, neg(Expr2))))
| Expr LE Expr (Ltz(Plus(Expr1, neg(Expr2))))
| Expr GE Expr (Ltz(Plus(Expr2, neg(Expr1))))
| Expr GT Expr (Ltz(Plus(Expr2, neg(Expr1))))
- For example, converts "1 = x^2 + y^2" into "0 = x^2 + y^2 + -(1)"| Expr LT Expr (Ltz(Plus(Expr1, neg(Expr2))))
| Expr LE Expr (Ltz(Plus(Expr1, neg(Expr2))))
| Expr GE Expr (Ltz(Plus(Expr2, neg(Expr1))))
| Expr GT Expr (Ltz(Plus(Expr2, neg(Expr1))))
- In this form, all solutions to the formula are "zeros"
- Uses interval arithmetic (implemented here) to identify subsections of the graph that contain x, y values for which the formula evaluates to zero
- Like a binary search, recursively searches smaller and smaller subsections of the graph for zeros until the interval size is too small to be visible. At this threshold, it can just draw a tiny line between the corners of the interval.
- Graphtoy (my backup)
- This is another cool piece of work by Inigo Quilez
- Something special: Graphtoy has a variable for elapsed time (t) which can be used to create animations
- Source code
- Interesting implementation details:
- Instead of implementing its own parser, Graphtoy turns the formulas into JavaScript snippets
- See the "iCompile" function which tweaks the inputted formula strings to be valid JavaScript and constructs Formula objects which can later be invoked