Bouncing Ball
Posted on 3/28/2021
Tags: Math
I mentioned here that TI calculators can make some simple animations:Tags: Math
"An upperclassman graphed some functions together which made it look like this circle was a ball bouncing down stairs."
I also mentioned something special about Graphtoy:
"Graphtoy has a variable for elapsed time (t) which can be used to create animations"
In this post, I'll recreate the bouncing ball animation using mathematical formulas in Graphtoy.
Browsing our shape catalog gives us a few useful components:
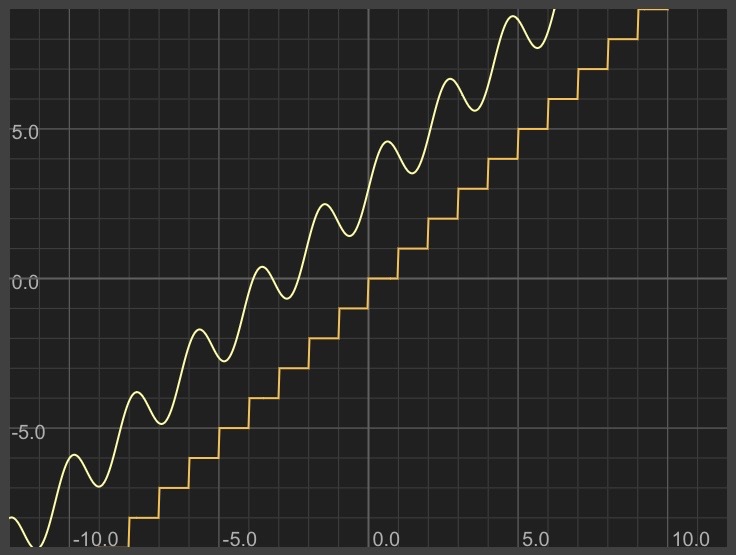
Steps: y = floor(x)
Diagonal sine wave: y = x + 3 + sin(3*x)
- This looks similar to the path of a ball as it bounces down steps
Graphtoy link
Here's what those look like together:
One aesthetic tweak: have the stairs go down to the right.
Adjust the sine wave to match the direction and slope of the stairs.
Steps: y = -floor(x)+5
Ball's path: y = -x + 5 + sin(3*-x)
Graphtoy link
With a normal (non-diagonal) sine wave, every other hump is negative and below the x-axis. In our diagonal sine wave, every other hump is going under a step instead of bouncing off it.
Let's figure out how to have a normal sine wave bounce off the x-axis and then bring that same modification to our more complex diagonal sine wave.
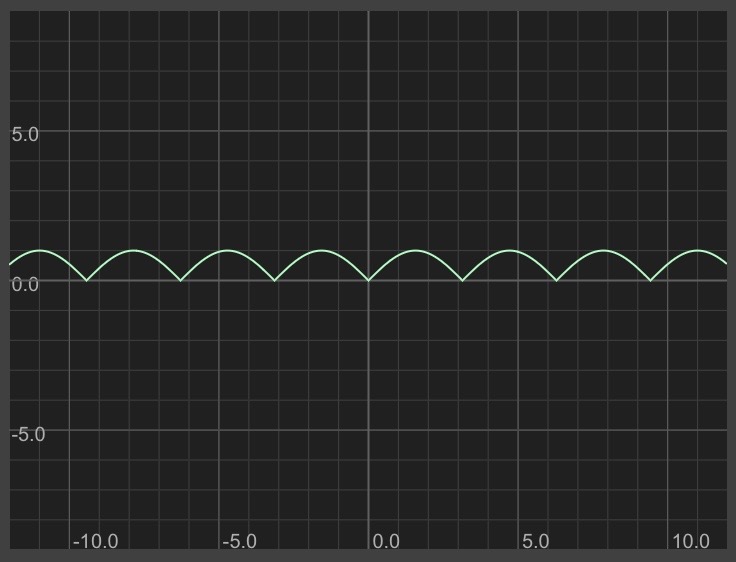
To simply make all negative values positive, we can take the absolute value with the abs() function:
y = abs(sin(x))
Here's what that looks like:
Looks promising! Let's try using abs on the diagonal sine wave:
y = -x + 5 + abs(sin(3*-x))
Graphtoy link
Here's what that looks like:
There are a few problems still:
- The bounce should happen in the middle of the step (not in the corner)
- It looks like the width of each period of the sine wave is not the same as the length of each step so there's visible drift
We can fix both of these using techniques noted in the shape catalog.
Shift the bounce to happen farther right:
y = -(x-0.5) + 5 + abs(sin(3*-(x-0.5)))
Graphtoy link
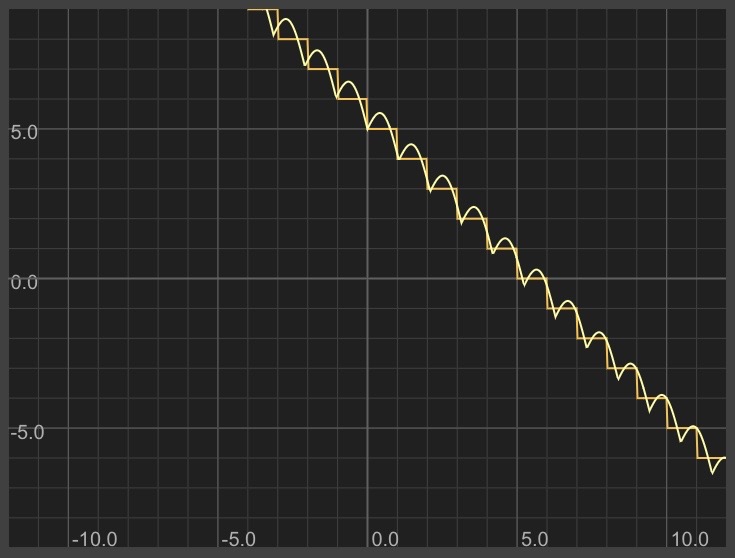
Fix the sine wave's period:
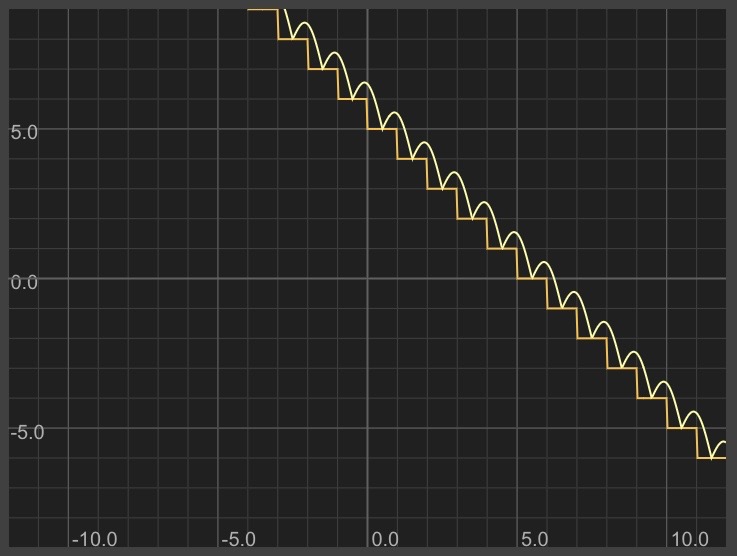
y = -(x-0.5) + 5 + abs(sin(PI*-(x-0.5)))
Graphtoy link
Here's what that looks like:
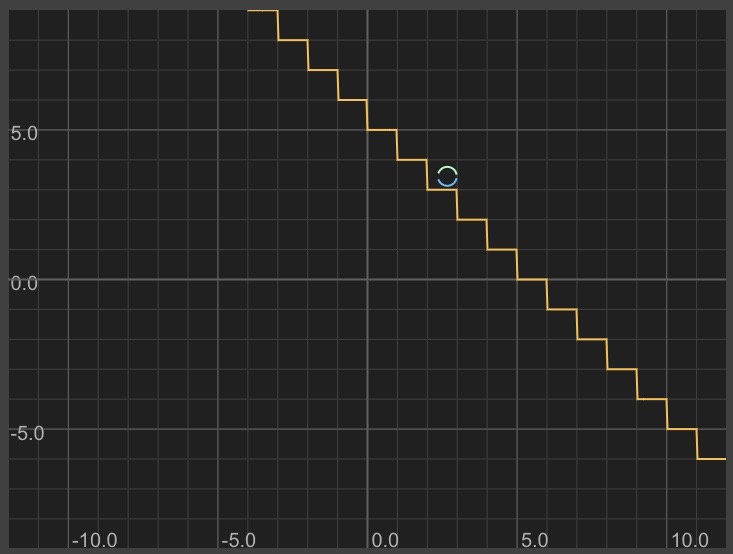
Now let's add our bouncing ball. We want to draw a circle that's centered on the diagonal bouncing sine wave.
From the shape catalog, here is the equation for a circle centered at (-3, 2):
y = sqrt(1 - (x+3)^2) + 2
y = -sqrt(1 - (x+3)^2) + 2
To have the ball move to the right with time, we'll replace the -3 with t. t is the special parameter Graphtoy provides; its value is the number of seconds that have passed since the webpage refreshed.
y = sqrt(1 - (x-t)^2) + 2
y = -sqrt(1 - (x-t)^2) + 2
Graphtoy link
The y-value at time t is the value of our bouncing sine wave when x=t.
Bouncing sine wave: y = -(x-0.5) + 5 + abs(sin(PI*-(x-0.5)))
Value when x=t:
y = -(t-0.5) + 5 + abs(sin(PI*-(t-0.5)))
Now, we'll replace the 2 in our circle equations with this y expression:
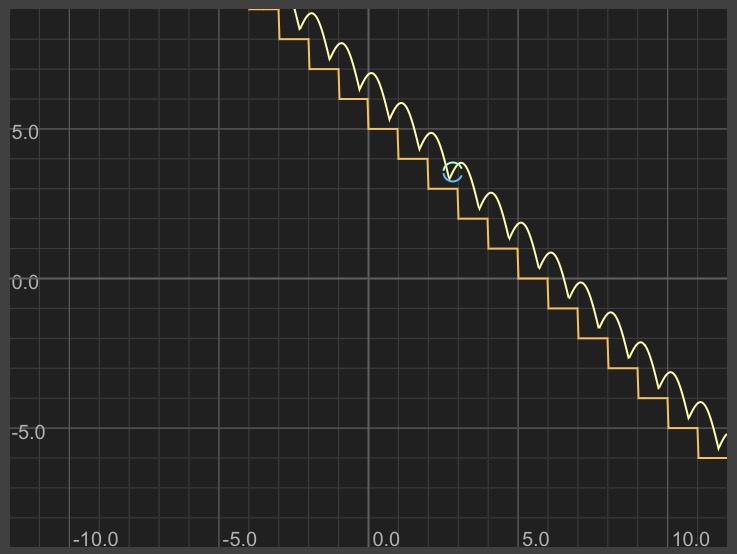
y = sqrt(1 - (x-t)^2) + (-(t-0.5) + 5 + abs(sin(PI*-(t-0.5))))
y = -sqrt(1 - (x-t)^2) + (-(t-0.5) + 5 + abs(sin(PI*-(t-0.5))))
Graphtoy link
Wow! This is getting really close!
The ball is way too big. Let's shrink its radius:
y = sqrt(0.1 - (x-t)^2) + (-(t-0.5) + 5 + abs(sin(PI*-(t-0.5))))
y = -sqrt(0.1 - (x-t)^2) + (-(t-0.5) + 5 + abs(sin(PI*-(t-0.5))))
Graphtoy link
(Note: once the circle moves off-screen, don't forget to reset t (or refresh the page) to make it reappear)
More tweaks needed:
- The ball bounces through the step. Need to shift the bouncing curve up by the ball's radius.
- The ball is too close to the edge of the step. Need to shift the bouncing curve farther to the right.
Shifting up and to the right:
Sine wave:
y = -(x-0.7) + 5 + sqrt(.1) + abs(sin(PI*-(x-0.7)))
Circle:
y = sqrt(0.1 - (x-t)^2) + (-(t-0.7) + 5 + sqrt(.1) + abs(sin(PI*-(t-0.7))))
y = -sqrt(0.1 - (x-t)^2) + (-(t-0.7) + 5 + sqrt(.1) + abs(sin(PI*-(t-0.7))))
Graphtoy link
Looks perfect!
Bonus just for fun, here's the ball bouncing off a square wave, losing height with every bounce:
Graphtoy link