Create COVID-19 Graphs Using JavaScript

Posted on 5/8/2020
Tags: Programming
COVID-19 has loomed over us for many months. For weeks, I watched the spread using graphs on politico.com.Tags: Programming
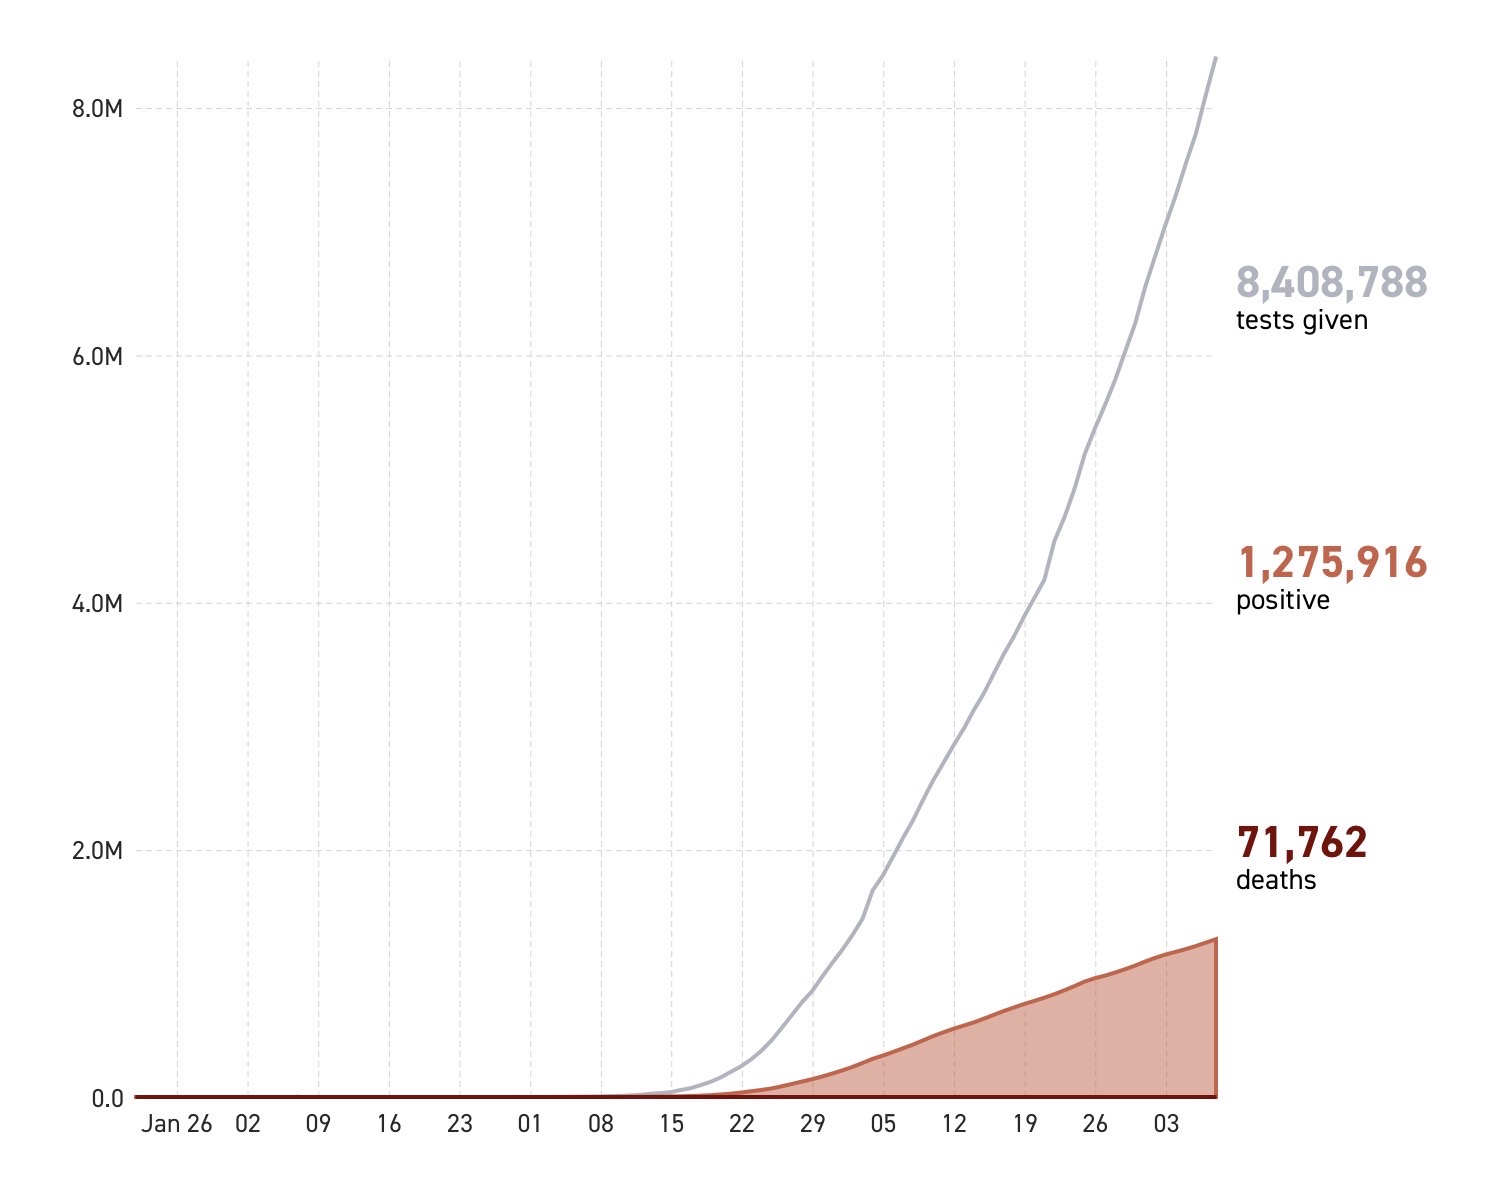
A few days went by without updates so I investigated recreating the graphs myself. Here’s my process:
1. I noticed that the website links to its data source. Fortunately, it comes from an open website with a convenient API: https://covidtracking.com/api
2. I knew I could use the Scriptable app on iOS to write some JavaScript to process and transform the data
3. Scriptable can draw some native UI but it’s often too limited. Instead, I chose to generate some HTML it can display in a web view.
4. I did some quick searches for simple ways to graph data on web pages. When I searched, one of the top hits was canvasJS.
5. I found a sample graph that looked similar to what I needed
6. To quickly check that this would work, I created a script in Scriptable to generate the HTML and show a web view, pasting in their example:
let html = `
<!DOCTYPE html>
<html>
<head>
<script>
window.onload = function() {
var chart = new CanvasJS.Chart("chartContainer", {
animationEnabled: true,
title: {
text: "Hourly Average CPU Utilization"
},
axisX: {
title: "Time"
},
axisY: {
title: "Percentage",
suffix: "%"
},
data: [{
type: "line",
name: "CPU Utilization",
connectNullData: true,
//nullDataLineDashType: "solid",
xValueType: "dateTime",
xValueFormatString: "DD MMM hh:mm TT",
yValueFormatString: "#,##0.##\"%\"",
dataPoints: [
{ x: 1501102673000, y: 22.836 },
{ x: 1501106273000, y: 23.220 },
{ x: 1501109873000, y: 23.594 },
{ x: 1501113473000, y: 24.596 },
{ x: 1501117073000, y: 31.947 },
{ x: 1501120673000, y: 31.142 }
]
}]
});
chart.render();
}
</script>
</head>
<body>
<div id="chartContainer" style="height: 300px; width: 100%;"></div>
<script src="https://canvasjs.com/assets/script/canvasjs.min.js"></script>
</body>
</html>
`
let webView = new WebView()
webView.loadHTML(html)
webView.present(true)
7. That worked! I then figured out how to request data from covidtracking.com — conveniently hosted in JSON format. I used console.log to sanity check the result.<!DOCTYPE html>
<html>
<head>
<script>
window.onload = function() {
var chart = new CanvasJS.Chart("chartContainer", {
animationEnabled: true,
title: {
text: "Hourly Average CPU Utilization"
},
axisX: {
title: "Time"
},
axisY: {
title: "Percentage",
suffix: "%"
},
data: [{
type: "line",
name: "CPU Utilization",
connectNullData: true,
//nullDataLineDashType: "solid",
xValueType: "dateTime",
xValueFormatString: "DD MMM hh:mm TT",
yValueFormatString: "#,##0.##\"%\"",
dataPoints: [
{ x: 1501102673000, y: 22.836 },
{ x: 1501106273000, y: 23.220 },
{ x: 1501109873000, y: 23.594 },
{ x: 1501113473000, y: 24.596 },
{ x: 1501117073000, y: 31.947 },
{ x: 1501120673000, y: 31.142 }
]
}]
});
chart.render();
}
</script>
</head>
<body>
<div id="chartContainer" style="height: 300px; width: 100%;"></div>
<script src="https://canvasjs.com/assets/script/canvasjs.min.js"></script>
</body>
</html>
`
let webView = new WebView()
webView.loadHTML(html)
webView.present(true)
let dailyDataRequest = new Request("https://covidtracking.com/api/v1/us/daily.json")
let dailyData = await dailyDataRequest.loadJSON()
console.log("Row 0: " + dailyData[0].positive)
8. From there, I parsed the data, transformed it, and added more charts. I included some charts that the original website didn’t have that I found interesting.let dailyData = await dailyDataRequest.loadJSON()
console.log("Row 0: " + dailyData[0].positive)
// Show graphs that match: https://www.politico.com/interactives/2020/coronavirus-testing-by-state-chart-of-new-cases/
// Data from: https://covidtracking.com/api
// Examples the charts are based on:
// https://canvasjs.com/javascript-charts/null-data-chart/
// https://canvasjs.com/javascript-charts/multi-series-chart/
// https://canvasjs.com/javascript-charts/stacked-column-chart/
// https://canvasjs.com/javascript-charts/stacked-bar-chart/
// https://canvasjs.com/javascript-charts/stacked-bar-100-chart/
let firstInterestingDate = 20200301
function dataPointsFromDailyDataJSON(json, key) {
// { x: new Date(2017,6,24), y: 31 },
var result = ""
for (let row of json) {
let value = row[key]
let date = row["date"]
// Data is uninteresting before March 1st: 20200301
if (date < firstInterestingDate) {
continue
}
let match = (date+"").match(/(\d{4})(\d{2})(\d{2})/)
let year = parseInt(match[1])
let month = parseInt(match[2])
let day = parseInt(match[3])
result += "{ x: new Date("+year+","+(month-1)+","+day+"), y: " + value + " },\n"
}
return result
}
function deltaDataPointsFromDailyDataJSON(json, key) {
// { x: new Date(2017,6,24), y: 31 },
var result = ""
// json is sorted newest to oldest so we need to iterate backwards
var index = json.length-1
var prevValue = json[index][key]
while (index >= 0) {
let row = json[index]
index--
let value = row[key]
let date = row["date"]
let delta = value - prevValue
prevValue = value
// Data is uninteresting before March 1st: 20200301
if (date < firstInterestingDate) {
continue
}
let match = (date+"").match(/(\d{4})(\d{2})(\d{2})/)
let year = parseInt(match[1])
let month = parseInt(match[2])
let day = parseInt(match[3])
result += "{ x: new Date("+year+","+(month-1)+","+day+"), y: " + delta + " },\n"
}
return result
}
var chartCount = 0
function chartTestsPositivesDeathsForState(json, state) {
// Filter the data to the correct state; null means US
let filteredJson = (state == null) ? json : json.filter(row => row["state"] == state)
let currentTotalTests = filteredJson[0]["totalTestResults"]
let totalTestsDataPoints = dataPointsFromDailyDataJSON(filteredJson, "totalTestResults")
let currentPositive = filteredJson[0]["positive"]
let positiveDataPoints = dataPointsFromDailyDataJSON(filteredJson, "positive")
let currentDeath = filteredJson[0]["death"]
let deathsDataPoints = dataPointsFromDailyDataJSON(filteredJson, "death")
let chartName = "chart" + (state == null ? "US" : state) + chartCount++
let chartJS = `
var ${chartName} = new CanvasJS.Chart("${chartName}", {
animationEnabled: false,
title:{
text: "Covid-19 in ${state == null ? "the United States" : state}",
fontSize: 25,
},
axisX: {
valueFormatString: "MMM DD"
},
axisY: {
title: "Count",
includeZero: true,
},
legend:{
cursor: "pointer",
fontSize: 16,
itemclick: toggleDataSeries
},
toolTip:{
shared: true
},
data: [{
name: "Total Tests (${currentTotalTests.toLocaleString()})",
type: "line",
lineColor: "gray",
color: "gray",
showInLegend: true,
dataPoints: [
${totalTestsDataPoints}
]
},
{
name: "Positive (${currentPositive.toLocaleString()})",
type: "line",
lineColor: "orange",
color: "orange",
showInLegend: true,
dataPoints: [
${positiveDataPoints}
]
},
{
name: "Deaths (${currentDeath.toLocaleString()})",
type: "line",
lineColor: "red",
color: "red",
showInLegend: true,
dataPoints: [
${deathsDataPoints}
]
}]
});
${chartName}.render();
`
return { chartJS: chartJS, chartName: chartName };
}
function chartDeltas(json, state) {
// Filter the data to the correct state; null means US
let filteredJson = (state == null) ? json : json.filter(row => row["state"] == state)
let currentTestsDeltaToday = filteredJson[0]["totalTestResults"] - filteredJson[1]["totalTestResults"]
let currentTestsDeltas = deltaDataPointsFromDailyDataJSON(filteredJson, "totalTestResults")
let positiveDeltaToday = filteredJson[0]["positive"] - filteredJson[1]["positive"]
let positiveDeltas = deltaDataPointsFromDailyDataJSON(filteredJson, "positive")
let deathsDeltaToday = filteredJson[0]["death"] - filteredJson[1]["death"]
let deathsDeltas = deltaDataPointsFromDailyDataJSON(filteredJson, "death")
let chartName = "chartDeltas" + (state == null ? "US" : state) + chartCount++
let chartJS = `
var ${chartName} = new CanvasJS.Chart("${chartName}", {
animationEnabled: false,
title:{
text: "Day-over-Day Change${state == null ? "" : " in " + state}",
fontSize: 25,
},
axisX: {
valueFormatString: "MMM DD"
},
axisY: {
title: "Count",
includeZero: true,
},
legend:{
cursor: "pointer",
fontSize: 16,
itemclick: toggleDataSeries
},
toolTip:{
shared: true
},
data: [{
name: "Total Tests Δ (${currentTestsDeltaToday.toLocaleString()})",
type: "line",
lineColor: "gray",
color: "gray",
showInLegend: true,
dataPoints: [
${currentTestsDeltas}
]
},
{
name: "Positive Δ (${positiveDeltaToday.toLocaleString()})",
type: "line",
lineColor: "orange",
color: "orange",
showInLegend: true,
dataPoints: [
${positiveDeltas}
]
},
{
name: "Deaths Δ (${deathsDeltaToday.toLocaleString()})",
type: "line",
lineColor: "red",
color: "red",
showInLegend: true,
dataPoints: [
${deathsDeltas}
]
}]
});
${chartName}.render();
`
return { chartJS: chartJS, chartName: chartName };
}
function sortedStateNames(json) {
// For the entry with today's date, sort the state names from highest positive count to lowest
let todaysDate = json[0].date
let todaysData = json.filter(row => row.date == todaysDate)
todaysData.sort((a, b) => b.positive - a.positive)
return todaysData.map(row => row.state)
}
function statesTestsBarChart(json) {
let todaysDate = json[0].date
let todaysData = json.filter(row => row.date == todaysDate)
todaysData.sort((a, b) => b.positive - a.positive)
let positiveDataPoints = todaysData.map(row => "{ y: "+row.positive+", label: '"+row.state+"' }")
let negativeDataPoints = todaysData.map(row => "{ y: "+(row.totalTestResults-row.positive)+", label: '"+row.state+"' }")
let chartName = "chartTestsBarChart" + chartCount++
let chartJS = `
var ${chartName} = new CanvasJS.Chart("${chartName}", {
animationEnabled: false,
title:{
text: "State Testing",
fontSize: 25,
},
axisX: {
title: "State",
interval: 1,
labelFontSize: 12,
},
axisY:{
title: "Count",
},
data: [{
type: "stackedColumn",
showInLegend: true,
color: "orange",
name: "Positive",
dataPoints: [
${positiveDataPoints.join(",")}
]
},
{
type: "stackedColumn",
showInLegend: true,
name: "Negative",
color: "gray",
dataPoints: [
${negativeDataPoints.join(",")}
]
},
]
});
${chartName}.render();
`
return { chartJS: chartJS, chartName: chartName };
}
var html = `
<!DOCTYPE HTML>
<html>
<head>
<script>
window.onload = function () {
`
var chartNames = []
// https://covidtracking.com/api/v1/us/daily.json
let dailyDataRequest = new Request("https://covidtracking.com/api/v1/us/daily.json")
let dailyData = await dailyDataRequest.loadJSON()
// US chart for tests given, positive tests, deaths
let usChart = chartTestsPositivesDeathsForState(dailyData, null)
html += usChart.chartJS
chartNames.push(usChart.chartName)
// US Deltas
let usDeltasChart = chartDeltas(dailyData, null)
html += usDeltasChart.chartJS
chartNames.push(usDeltasChart.chartName)
// Per-state tests, positive, deaths charts sorted by most positive
// https://covidtracking.com/api/v1/states/daily.json
let stateDataRequest = new Request("https://covidtracking.com/api/v1/states/daily.json")
let stateData = await stateDataRequest.loadJSON()
// States tests stacked bar chart
let testsBarChart = statesTestsBarChart(stateData)
html += testsBarChart.chartJS
chartNames.push(testsBarChart.chartName)
// California
let caChart = chartTestsPositivesDeathsForState(stateData, "CA")
html += caChart.chartJS
chartNames.push(caChart.chartName)
let caDeltasChart = chartDeltas(stateData, "CA")
html += caDeltasChart.chartJS
chartNames.push(caDeltasChart.chartName)
// Sorted state data
let sortedStates = sortedStateNames(stateData)
for (let state of sortedStates) {
let stateChart = chartTestsPositivesDeathsForState(stateData, state)
html += stateChart.chartJS
chartNames.push(stateChart.chartName)
}
html += `
function toggleDataSeries(e){
if (typeof(e.dataSeries.visible) === "undefined" || e.dataSeries.visible) {
e.dataSeries.visible = false;
}
else{
e.dataSeries.visible = true;
}
chart.render();
}
}
</script>
</head>
<body>
`
var index = 0
for (let chartName of chartNames) {
var width = "100%" // US data, tests for all states
if (index >= 5) { // sorted states
width = "33%"
} else if (index >= 3) { // California
width = "50%"
}
html += '<div id="'+chartName+'" style="height: 500px; width: '+width+'; display: inline-block;"></div>'
if (index == 1 || index == 2 || (index % 3) == 1) {
html += "<br /><br />"
}
index++
}
html += `
<script src="https://canvasjs.com/assets/script/canvasjs.min.js"></script>
</body>
</html>
`
let webView = new WebView()
webView.loadHTML(html)
webView.present(true)
Resources:// Data from: https://covidtracking.com/api
// Examples the charts are based on:
// https://canvasjs.com/javascript-charts/null-data-chart/
// https://canvasjs.com/javascript-charts/multi-series-chart/
// https://canvasjs.com/javascript-charts/stacked-column-chart/
// https://canvasjs.com/javascript-charts/stacked-bar-chart/
// https://canvasjs.com/javascript-charts/stacked-bar-100-chart/
let firstInterestingDate = 20200301
function dataPointsFromDailyDataJSON(json, key) {
// { x: new Date(2017,6,24), y: 31 },
var result = ""
for (let row of json) {
let value = row[key]
let date = row["date"]
// Data is uninteresting before March 1st: 20200301
if (date < firstInterestingDate) {
continue
}
let match = (date+"").match(/(\d{4})(\d{2})(\d{2})/)
let year = parseInt(match[1])
let month = parseInt(match[2])
let day = parseInt(match[3])
result += "{ x: new Date("+year+","+(month-1)+","+day+"), y: " + value + " },\n"
}
return result
}
function deltaDataPointsFromDailyDataJSON(json, key) {
// { x: new Date(2017,6,24), y: 31 },
var result = ""
// json is sorted newest to oldest so we need to iterate backwards
var index = json.length-1
var prevValue = json[index][key]
while (index >= 0) {
let row = json[index]
index--
let value = row[key]
let date = row["date"]
let delta = value - prevValue
prevValue = value
// Data is uninteresting before March 1st: 20200301
if (date < firstInterestingDate) {
continue
}
let match = (date+"").match(/(\d{4})(\d{2})(\d{2})/)
let year = parseInt(match[1])
let month = parseInt(match[2])
let day = parseInt(match[3])
result += "{ x: new Date("+year+","+(month-1)+","+day+"), y: " + delta + " },\n"
}
return result
}
var chartCount = 0
function chartTestsPositivesDeathsForState(json, state) {
// Filter the data to the correct state; null means US
let filteredJson = (state == null) ? json : json.filter(row => row["state"] == state)
let currentTotalTests = filteredJson[0]["totalTestResults"]
let totalTestsDataPoints = dataPointsFromDailyDataJSON(filteredJson, "totalTestResults")
let currentPositive = filteredJson[0]["positive"]
let positiveDataPoints = dataPointsFromDailyDataJSON(filteredJson, "positive")
let currentDeath = filteredJson[0]["death"]
let deathsDataPoints = dataPointsFromDailyDataJSON(filteredJson, "death")
let chartName = "chart" + (state == null ? "US" : state) + chartCount++
let chartJS = `
var ${chartName} = new CanvasJS.Chart("${chartName}", {
animationEnabled: false,
title:{
text: "Covid-19 in ${state == null ? "the United States" : state}",
fontSize: 25,
},
axisX: {
valueFormatString: "MMM DD"
},
axisY: {
title: "Count",
includeZero: true,
},
legend:{
cursor: "pointer",
fontSize: 16,
itemclick: toggleDataSeries
},
toolTip:{
shared: true
},
data: [{
name: "Total Tests (${currentTotalTests.toLocaleString()})",
type: "line",
lineColor: "gray",
color: "gray",
showInLegend: true,
dataPoints: [
${totalTestsDataPoints}
]
},
{
name: "Positive (${currentPositive.toLocaleString()})",
type: "line",
lineColor: "orange",
color: "orange",
showInLegend: true,
dataPoints: [
${positiveDataPoints}
]
},
{
name: "Deaths (${currentDeath.toLocaleString()})",
type: "line",
lineColor: "red",
color: "red",
showInLegend: true,
dataPoints: [
${deathsDataPoints}
]
}]
});
${chartName}.render();
`
return { chartJS: chartJS, chartName: chartName };
}
function chartDeltas(json, state) {
// Filter the data to the correct state; null means US
let filteredJson = (state == null) ? json : json.filter(row => row["state"] == state)
let currentTestsDeltaToday = filteredJson[0]["totalTestResults"] - filteredJson[1]["totalTestResults"]
let currentTestsDeltas = deltaDataPointsFromDailyDataJSON(filteredJson, "totalTestResults")
let positiveDeltaToday = filteredJson[0]["positive"] - filteredJson[1]["positive"]
let positiveDeltas = deltaDataPointsFromDailyDataJSON(filteredJson, "positive")
let deathsDeltaToday = filteredJson[0]["death"] - filteredJson[1]["death"]
let deathsDeltas = deltaDataPointsFromDailyDataJSON(filteredJson, "death")
let chartName = "chartDeltas" + (state == null ? "US" : state) + chartCount++
let chartJS = `
var ${chartName} = new CanvasJS.Chart("${chartName}", {
animationEnabled: false,
title:{
text: "Day-over-Day Change${state == null ? "" : " in " + state}",
fontSize: 25,
},
axisX: {
valueFormatString: "MMM DD"
},
axisY: {
title: "Count",
includeZero: true,
},
legend:{
cursor: "pointer",
fontSize: 16,
itemclick: toggleDataSeries
},
toolTip:{
shared: true
},
data: [{
name: "Total Tests Δ (${currentTestsDeltaToday.toLocaleString()})",
type: "line",
lineColor: "gray",
color: "gray",
showInLegend: true,
dataPoints: [
${currentTestsDeltas}
]
},
{
name: "Positive Δ (${positiveDeltaToday.toLocaleString()})",
type: "line",
lineColor: "orange",
color: "orange",
showInLegend: true,
dataPoints: [
${positiveDeltas}
]
},
{
name: "Deaths Δ (${deathsDeltaToday.toLocaleString()})",
type: "line",
lineColor: "red",
color: "red",
showInLegend: true,
dataPoints: [
${deathsDeltas}
]
}]
});
${chartName}.render();
`
return { chartJS: chartJS, chartName: chartName };
}
function sortedStateNames(json) {
// For the entry with today's date, sort the state names from highest positive count to lowest
let todaysDate = json[0].date
let todaysData = json.filter(row => row.date == todaysDate)
todaysData.sort((a, b) => b.positive - a.positive)
return todaysData.map(row => row.state)
}
function statesTestsBarChart(json) {
let todaysDate = json[0].date
let todaysData = json.filter(row => row.date == todaysDate)
todaysData.sort((a, b) => b.positive - a.positive)
let positiveDataPoints = todaysData.map(row => "{ y: "+row.positive+", label: '"+row.state+"' }")
let negativeDataPoints = todaysData.map(row => "{ y: "+(row.totalTestResults-row.positive)+", label: '"+row.state+"' }")
let chartName = "chartTestsBarChart" + chartCount++
let chartJS = `
var ${chartName} = new CanvasJS.Chart("${chartName}", {
animationEnabled: false,
title:{
text: "State Testing",
fontSize: 25,
},
axisX: {
title: "State",
interval: 1,
labelFontSize: 12,
},
axisY:{
title: "Count",
},
data: [{
type: "stackedColumn",
showInLegend: true,
color: "orange",
name: "Positive",
dataPoints: [
${positiveDataPoints.join(",")}
]
},
{
type: "stackedColumn",
showInLegend: true,
name: "Negative",
color: "gray",
dataPoints: [
${negativeDataPoints.join(",")}
]
},
]
});
${chartName}.render();
`
return { chartJS: chartJS, chartName: chartName };
}
var html = `
<!DOCTYPE HTML>
<html>
<head>
<script>
window.onload = function () {
`
var chartNames = []
// https://covidtracking.com/api/v1/us/daily.json
let dailyDataRequest = new Request("https://covidtracking.com/api/v1/us/daily.json")
let dailyData = await dailyDataRequest.loadJSON()
// US chart for tests given, positive tests, deaths
let usChart = chartTestsPositivesDeathsForState(dailyData, null)
html += usChart.chartJS
chartNames.push(usChart.chartName)
// US Deltas
let usDeltasChart = chartDeltas(dailyData, null)
html += usDeltasChart.chartJS
chartNames.push(usDeltasChart.chartName)
// Per-state tests, positive, deaths charts sorted by most positive
// https://covidtracking.com/api/v1/states/daily.json
let stateDataRequest = new Request("https://covidtracking.com/api/v1/states/daily.json")
let stateData = await stateDataRequest.loadJSON()
// States tests stacked bar chart
let testsBarChart = statesTestsBarChart(stateData)
html += testsBarChart.chartJS
chartNames.push(testsBarChart.chartName)
// California
let caChart = chartTestsPositivesDeathsForState(stateData, "CA")
html += caChart.chartJS
chartNames.push(caChart.chartName)
let caDeltasChart = chartDeltas(stateData, "CA")
html += caDeltasChart.chartJS
chartNames.push(caDeltasChart.chartName)
// Sorted state data
let sortedStates = sortedStateNames(stateData)
for (let state of sortedStates) {
let stateChart = chartTestsPositivesDeathsForState(stateData, state)
html += stateChart.chartJS
chartNames.push(stateChart.chartName)
}
html += `
function toggleDataSeries(e){
if (typeof(e.dataSeries.visible) === "undefined" || e.dataSeries.visible) {
e.dataSeries.visible = false;
}
else{
e.dataSeries.visible = true;
}
chart.render();
}
}
</script>
</head>
<body>
`
var index = 0
for (let chartName of chartNames) {
var width = "100%" // US data, tests for all states
if (index >= 5) { // sorted states
width = "33%"
} else if (index >= 3) { // California
width = "50%"
}
html += '<div id="'+chartName+'" style="height: 500px; width: '+width+'; display: inline-block;"></div>'
if (index == 1 || index == 2 || (index % 3) == 1) {
html += "<br /><br />"
}
index++
}
html += `
<script src="https://canvasjs.com/assets/script/canvasjs.min.js"></script>
</body>
</html>
`
let webView = new WebView()
webView.loadHTML(html)
webView.present(true)
- Backup of the canvasJS library
- Snapshot of US Daily data
- Snapshot of States Daily data